
Strokes Gained in Golf Betting: How to Read SG Data and Translate It Into System Picks
 Available in US
About four years into building golf betting systems, I spent a week trying to work out why my selections on links-style courses were consistently underperforming my parkland picks by a margin that could not be explained by variance. The answer turned out to be embarrassingly straightforward: I was using the same strokes gained weighting across all course types. SG: Approach to the Green numbers that predict brilliantly at Augusta or TPC Sawgrass mean something entirely different when the wind is blowing at 30mph across the Ayrshire coast. Once I started applying course-type filters to my SG data, the underperformance disappeared inside two seasons. That experience taught me the most important thing about strokes gained data: it is not a single number you look at. It is a framework you interrogate.
In 2026, strokes gained is no longer a niche analytical concept — it is the primary analytical currency of professional golf prediction. The question for UK bettors is not whether to use it, but how to use it well. The category structure, the recency weighting, the course-type application, the interaction with bookmaker pricing — all of it matters, and getting any one element wrong can turn a genuinely insightful model into an expensive liability.
Strokes gained, for anyone coming to this without the background, is a statistical framework that measures every player action on the course relative to the tour average from the same position. A player who takes 2.8 putts per green in regulation is gaining approximately 0.4 strokes per round on putting relative to the tour mean. A player who approaches from 150 yards to an average distance of 18 feet is gaining significantly on approach. The innovation is that it separates luck from skill more cleanly than traditional statistics like greens in regulation, which conflate long and short approaches into a single binary outcome. Fried Egg Golf’s analysis showed that SG: Approach contributed roughly 30% of winning strokes for Masters top-5 finishers over the past five years — not putting, not driving. Approach. That specific finding should tell you immediately which metric to weight most heavily when handicapping Augusta.
The Four SG Categories That Matter for Betting: OTT, APP, ATG, and Putting
The strokes gained framework divides the game into four primary categories, and each one has a different predictive profile for betting purposes. Understanding what each measures and how stable it is over time is the starting point for any serious SG-based betting model.
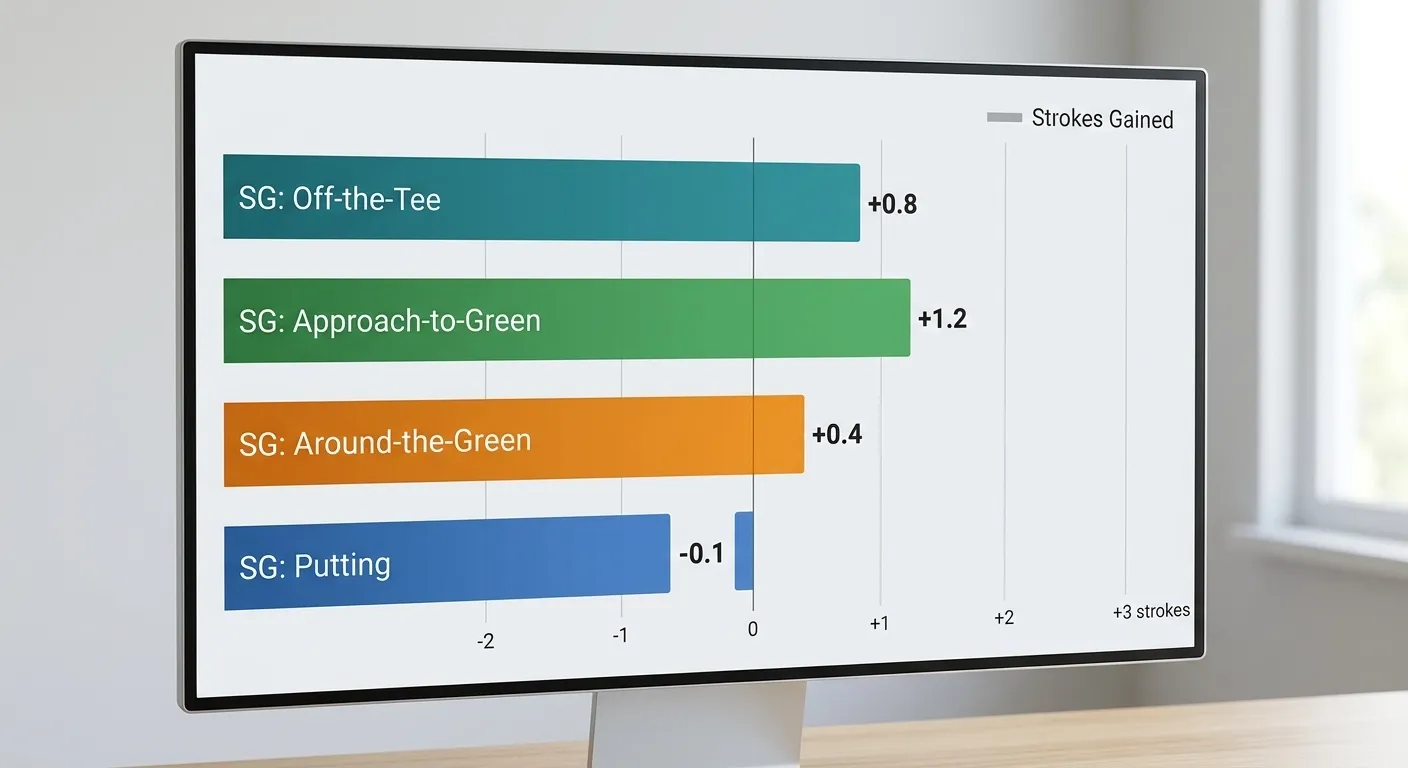
SG: Off-the-Tee (OTT) measures driving — specifically, how many strokes a player gains or loses relative to tour average from the tee on par-4s and par-5s. It captures both driving distance and driving accuracy, weighted by the expected difficulty of the resulting shot position. A player who drives it 320 yards but consistently into rough may gain less than a player who drives it 295 yards but consistently into the fairway, depending on the specific course’s rough penalty. OTT is moderately predictable — that is, a player’s SG: OTT over 20 rounds is a reasonable predictor of their OTT in the next 20 rounds. But “moderately predictable” is not “highly predictable.” Variance is significant, particularly for distance-based OTT gains that are sensitive to wind conditions.
SG: Approach-to-the-Green (APP) is the most predictive category for overall scoring in strokeplay, and — critically for betting — the most predictive category for Major Championship results. DataGolf’s analysis confirmed that none of the five most recent Masters champions ranked in the top 10 of their field for SG: Putting in the week they won. What united them was approach play. APP measures ball-striking quality from roughly 50-250 yards, and it is the category most closely linked to the mechanical, repeatable aspects of the golf swing. It is also more stable over rolling 24-36 round windows than OTT, which means it is a more reliable input for pre-tournament handicapping.
SG: Around-the-Green (ATG) covers shots from within roughly 50 yards — chips, pitches, greenside bunker play. This is a moderately volatile category. ATG involves a degree of skill that is genuinely measurable over large samples, but week-to-week variance is high. A player who leads the tour in ATG over 50 rounds may have a genuinely superior short game, or may simply have encountered conditions where their specific shot-making was rewarded. For betting purposes, ATG is a supporting data point rather than a primary predictor. Weight it at roughly half the importance of APP in most models.
SG: Putting is the most volatile of all four categories, and arguably the most dangerous input to weight heavily in a pre-tournament betting model. Putting varies enormously week-to-week even for elite putters, because it is sensitive to green speed, grain, slope consistency, and the inherently high-variance nature of reading and executing putts from varying distances. DataGolf’s data confirms this: season-long SG: Putting leaders frequently put up mediocre numbers in individual weeks, and short-term putting runs — both hot and cold — are common. The Masters data noted earlier — no top-5 putter in the top 10 of the winner’s field in five consecutive years — is a striking illustration of how little putting predicts outright victory even at the highest level.
The practical implication for your betting model: weight APP at roughly 35-40% of your overall SG composite, OTT at 25-30%, ATG at 15-20%, and Putting at 10-15%. These are not fixed constants — they should be adjusted based on course type (more on that in the next section) — but they represent a reasonable starting framework derived from the predictive research available as of 2026.
Which Strokes Gained Categories Are Actually Predictable – And Which Are Just Noise
Here is the uncomfortable truth about strokes gained data that anyone who has built a golf prediction model has eventually confronted: most of the variation in golf scoring from week to week is noise. Matt Courchene, co-founder of DataGolf, put it plainly in a 2025 interview: “Golf is noisy: most of the variation in any particular player’s score on any given day is unpredictable. The hardest thing about forecasting golf is finding what is actually predictable.” That is not pessimism — it is the honest starting point for building a model that actually works.
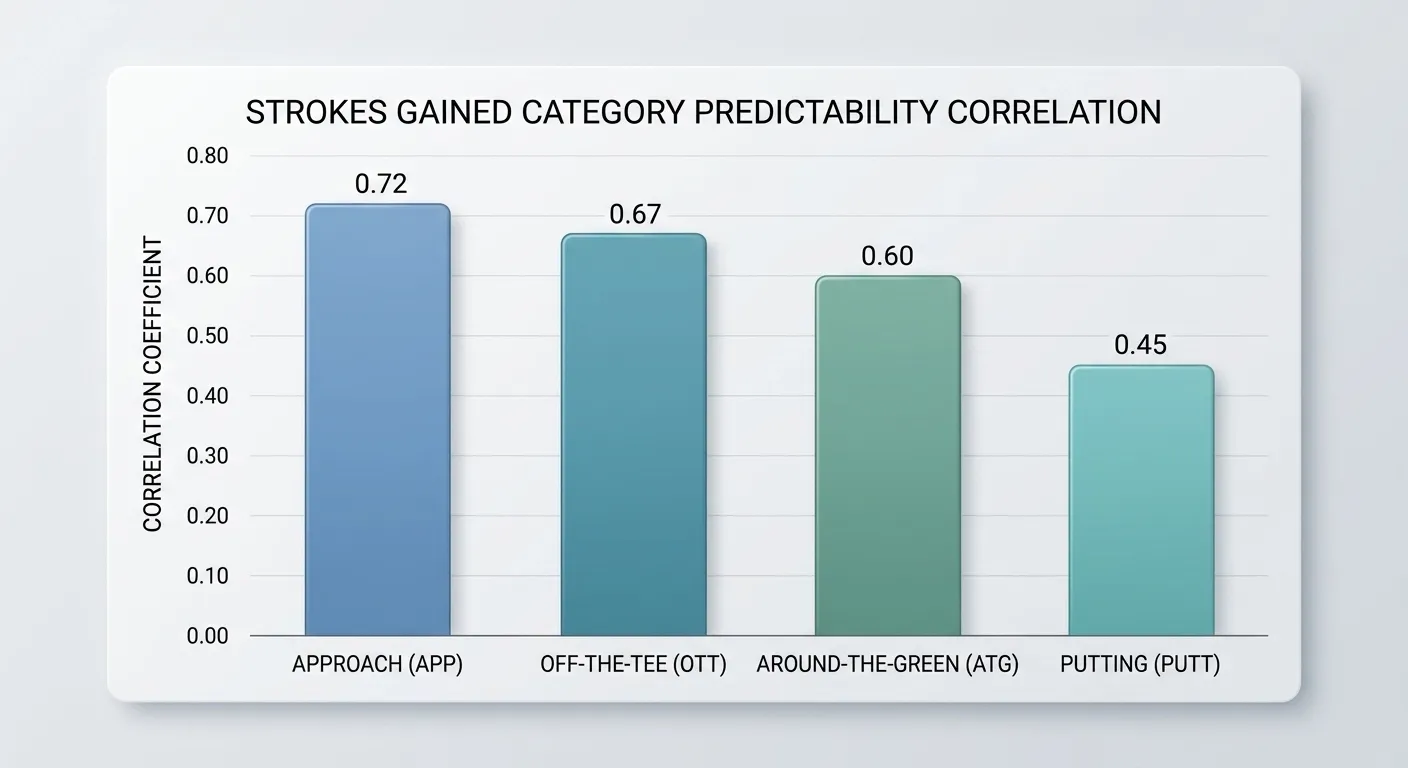
The predictability hierarchy across SG categories is roughly as follows, from most to least stable over 20-round windows. SG: Approach leads, with a correlation between consecutive 20-round periods of around 0.70-0.75 for PGA Tour players (meaning 70-75% of the variation in a player’s next-20-round APP is explained by their prior-20-round APP). SG: OTT is next at roughly 0.65-0.70, reflecting the physical repeatability of driving mechanics — a long hitter tends to stay a long hitter. SG: ATG runs at roughly 0.55-0.65, reflecting genuine skill overlaid with meaningful variance. SG: Putting is lowest, typically in the 0.40-0.50 range, confirming that while some putters are genuinely better than others over large samples, the week-to-week predictive power is poor.
These correlations have a direct implication for how far back you should look. For APP and OTT, 24-36 rounds of recent data (roughly 6-9 tournament appearances) is the sweet spot. You want enough data to smooth out variance but not so much data that you are averaging in rounds from 18 months ago when the player’s mechanics or equipment may have been different. For Putting, you genuinely need larger samples — 50 rounds or more — to separate skill from luck with any confidence. But because putting is so volatile in-period, even a large-sample SG: Putting edge carries limited predictive weight for a specific upcoming tournament.
Courchene also described how DataGolf’s own model improvement process worked: “Constantly comparing our probabilities to the betting market revealed model flaws, leading to improvements: accounting for weather forecasts by tee time, adjusting player skill when leading, adding national effects by host country.” The last point — national effects by host country, specifically that American players underperform at The Open Championship — is a concrete example of how systematic observation of model-vs-market discrepancies drives model refinement. For bettors working without DataGolf’s computational infrastructure, the takeaway is to track your own discrepancies obsessively. Where you consistently lose is where your model is missing something.
Where to Access Strokes Gained Data: PGA Tour Stats, DataGolf, and DP World Tour
The data infrastructure available to UK golf bettors in 2026 is substantially better than it was even five years ago, though meaningful gaps remain — particularly for the DP World Tour.

PGA Tour statistics are available at no cost through the tour’s official website, which publishes strokes gained data for all four categories across all regular-season events. The data is broadly reliable and updated promptly after each round. The limitation is granularity: the official site provides aggregate statistics but limited tools for filtering by course type, applying recency weighting, or comparing relative performance across different field strengths. For basic SG lookups, it is adequate. For model-building, it is a starting point, not a finish line.
DataGolf is the most sophisticated publicly accessible golf analytics platform available to UK bettors. Courchene’s description of the platform’s origins is relevant: when sports betting was legalised in the US in 2018, DataGolf pivoted to become something of an accidental bookmaking operation, providing model-based odds that bettors could compare to the market. The process of comparing model output to real-market prices revealed and corrected model flaws iteratively. The result is a model that has been calibrated against actual betting market prices across thousands of data points. DataGolf provides pre-tournament win probabilities, top-10 probabilities, course-adjusted SG data, and historical course performance tools including the Course History feature referenced in Major handicapping. The core analytics are accessible through a subscription that UK bettors will find reasonably priced relative to the information value.
For DP World Tour events, the picture is less complete. Official strokes gained data is not published in the same comprehensive format as PGA Tour, and independent analytics platforms provide less granular DP World Tour coverage. The practical workarounds are: using dual-card players’ PGA Tour SG data as a proxy (with appropriate adjustments for field strength differences), relying on traditional statistics like greens in regulation, fairways hit, and putts per GIR as SG proxies where direct SG data is unavailable, and treating DP World Tour predictions as carrying higher uncertainty than PGA Tour predictions — adjusting your staking accordingly.
Applying SG to Course Type: When Ball-Striking Beats Putting and Vice Versa
The course-type adjustment to SG weighting is where the real edge in strokes gained analysis concentrates for bettors who have done the work. Most commercially available golf analytics apply broadly consistent SG weights regardless of course type. That is a simplification that creates pricing errors — and pricing errors are where systematic bettors make money.

The distinction that matters most at the extremes is between courses where the premium is on precision approach play versus courses where scrambling and putting variance determine results. Augusta National — the most studied course in golf — falls clearly into the first category. The DataGolf research confirming that Masters winners consistently excel on approach play and not on putting tells you where to look: SG: APP in the 16/1 to 50/1 range who are genuinely elite approach players, weighted against players in the same price range who are primarily putting-led. The ball-striker at 40/1 is likely underpriced relative to the putting-led player at the same price.
Links courses on the DP World Tour and at The Open Championship present the opposite challenge. Wind-affected scoring makes approach yardages inconsistent and green surfaces faster and bumpier than parkland equivalents. SG: Around-the-Green becomes more important, because players who struggle with bump-and-run approaches, low shots into greens, and inconsistent lie conditions will drop shots at links that they would not drop elsewhere. SG: OTT also takes on greater importance, because positioning the ball on the short stuff at links courses provides a disproportionate advantage. SG: APP from standard parkland yardages is a weaker signal at links events because the shot demands are fundamentally different.
For the interaction between SG data and course-specific factors, see our guide to course fit golf betting, which covers the full framework for overlaying strokes gained data on course profiles. The short version for this section: before applying any SG composite to a tournament, identify the primary scoring drivers at that venue and adjust your category weights accordingly. Augusta gets maximum APP weight, minimum putting weight. Royal Liverpool gets elevated OTT and ATG weight. TPC Sawgrass gets maximum APP weight, with significant OTT weight because of its water-adjacent fairways. The adjustment is not a minor refinement — it is the difference between a model that reflects reality and one that averages it into mediocrity.
Recency Weighting in SG Models: How Much Do Last 24 Rounds Matter?
The question of how many rounds of SG data to include in a pre-bet model is one I am still calibrating after nine years. The honest answer is that there is no universally correct window — but there are clearly wrong approaches, and most casual golf bettors make one of two errors: using too small a sample or weighting recent form too heavily.

Using fewer than 20 rounds of data to estimate a player’s SG profile is essentially reading noise. Golf’s variance is high enough that a player’s 8-round SG: APP figure tells you little about their genuine approach play level. Outlier weeks — a single tournament with unusually fast or slow greens, a week in difficult wind conditions — can inflate or deflate any category meaningfully. The correlations described in the predictability section assume samples of at least 20 rounds, and below that threshold, the predictive power drops off sharply.
At the other extreme, averaging across more than 50 rounds without decay weighting treats a round from 14 months ago as equally informative as a round from last week. For most players, that is not realistic. Players change coaches, change equipment, develop new shot shapes, or simply improve or decline. A model that looks at 72 rounds of flat-weighted data will include stale information that dilutes the signal from recent play.
A reasonable approach is a decay-weighted window of 36 rounds, with the most recent 12 rounds receiving double the weight of rounds 13-24, and rounds 25-36 receiving half weight. This applies exponential decay to older data while retaining enough sample size to smooth variance. For players returning from injury with fewer than 24 rounds since their return, weight only the post-return data and acknowledge elevated uncertainty in your confidence level. For players who have recently changed coaches or swing mechanics — a fact you will need to track manually — consider resetting their SG history from the point of the change.
Where Bookmakers Misprice SG Data: Finding the Systematic Edge in Mid-Range Prices
The market efficiency question is the one that ultimately determines whether building a strokes gained model is worth your time. If bookmakers are already accurately pricing SG data, your model will merely replicate the market with extra steps. The evidence suggests this is not the case — but the inefficiencies are not evenly distributed, and they have shifted as SG analysis has become more mainstream.
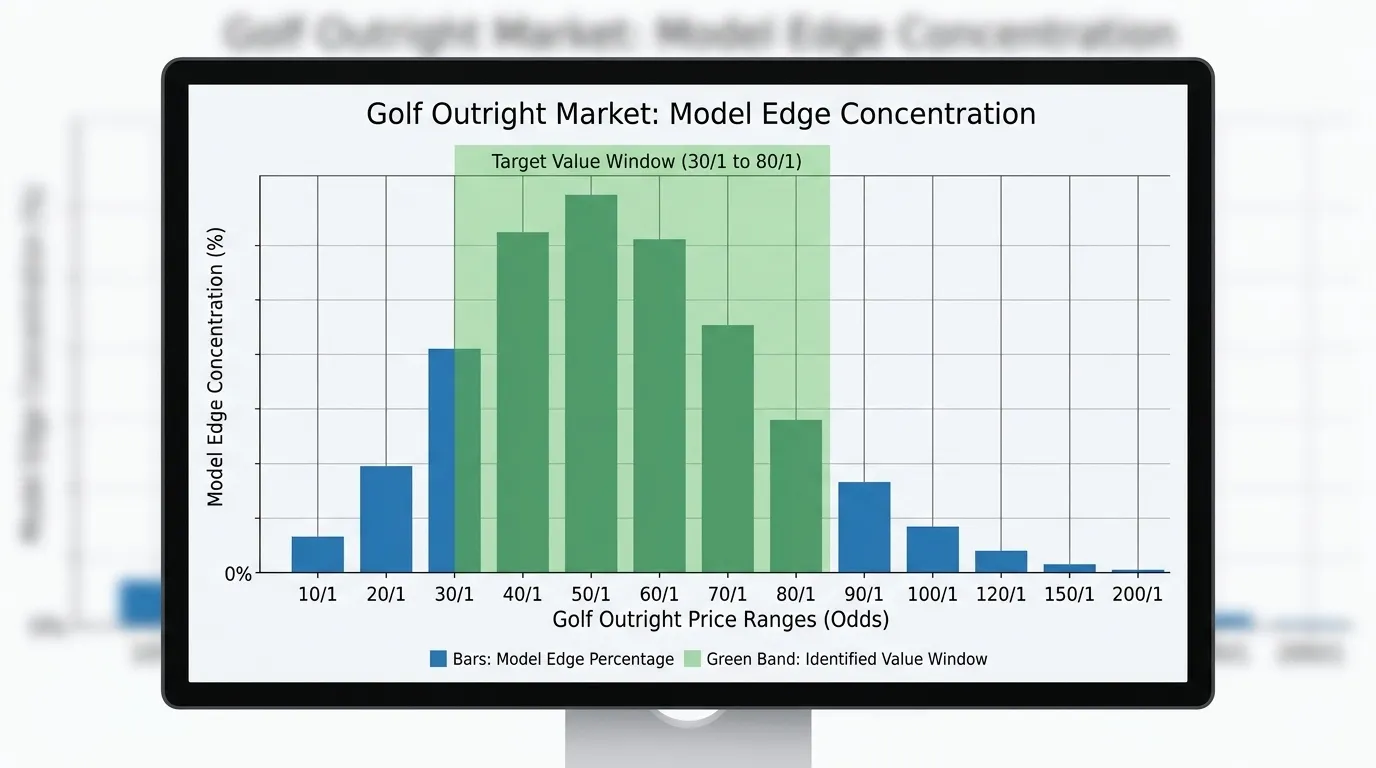
The price range where SG-based models have historically identified the most consistent edges is 30/1 to 80/1. At shorter prices — below 20/1 — the favourite market attracts the most analytical attention from bookmakers and sharp bettors. These markets are informationally efficient, and finding a genuine edge there requires either superior data or superior processing of the same data, which is a high bar. At very long prices — above 150/1 — the probability increments are small enough that model accuracy matters less than variance, and the place-betting structure typically captures more of the available value anyway.
The 30/1 to 80/1 window is where a competent SG-based model can identify players who are systematically underpriced. This happens because bookmakers weight traditional statistics, narrative factors (recent wins, high-profile coverage), and historical price anchors when setting odds. A player at 60/1 who has quietly assembled elite APP numbers over 36 rounds but has not won recently and lacks media visibility is a candidate for mispricing. The bookmaker’s model may have him at 50/1 internally, but because he does not attract money and the price has not been pressed, he sits at 60/1. That gap — between 50/1 fair value and 60/1 market price — represents genuine expected value.
BetPredictionSite’s analysis of data-driven golf betting identified this directly: “Golf betting is primarily about working with numbers. If you know how to read strokes gained data, you will have an advantage that most bettors miss. You should not be chasing the favourite — you should be finding value in the mid-price range, 30/1 to 80/1.” The operational question is how to identify which mid-range players your SG model rates above the market. That requires building a weekly workflow, which the next section covers.
A Practical SG-Based Pre-Bet Workflow for UK Golf Bettors
Theory is useful. Repeatable process is what produces results. Here is the workflow I run before every PGA Tour event where I am considering a bet.
On Tuesday, pull the SG data for all players likely to be priced between 25/1 and 100/1. Do not bother with favourites below 20/1 — the market is too efficient there for most bettors to find consistent edge. Do not go above 100/1 without a very specific course-fit reason. Pull 36 rounds of SG for each player with decay weighting, and calculate a composite score using your category weights for that specific course type. This gives you a ranked list of players by model-estimated skill level, independent of market price.
On Wednesday, pull the current outright prices from three bookmakers: bet365, BoyleSports, and a third of your choice. Calculate the implied probability from each price. Compare it to your model probability. Any player where your model probability is 20% or more above the implied market probability is a candidate for further review. A player at 50/1 (implied probability 1.96%) whom your model rates at 2.8% is a 43% model-vs-market discrepancy. That warrants attention.
For each candidate, apply a course-fit sanity check: does this player’s SG profile actually match what this course rewards? APP-heavy player at a course that rewards scrambling and OTT? Reduce confidence. OTT-heavy player at a tight driving accuracy course? Flag it. Players whose SG profile conflicts with the course’s primary scoring demands frequently look attractive in the raw model numbers and underperform on the course.
On Thursday morning, confirm the price and check each-way terms at bet365 and BoyleSports. If your model edge remains and the each-way structure is available, place the bet. If the price has moved significantly toward fair value overnight, review whether the edge is still present or has been arbitraged away.
This workflow takes roughly two to three hours on a Tuesday and 30-45 minutes on Wednesday and Thursday morning. It is not passive, but it is systematic — and systematic is the only approach that generates verifiable, improvable results over time.
Strokes Gained Betting: Common Questions
The questions I hear most from bettors trying to integrate SG into their approach fall into a few recurring categories. The most important ones are worth addressing directly.
On which category is the strongest predictor of tournament wins: it is SG: Approach, unequivocally. The Masters data — where SG: APP drove roughly 30% of winning strokes for top-5 finishers over five years, with SG: Putting barely featuring in the top-10 profiles — is consistent with the broader correlation analysis across PGA Tour events. APP predicts because it reflects ball-striking quality, which is more mechanically repeatable and therefore more forecastable than the high-variance putting category.
On DP World Tour data availability: it is genuinely limited compared to PGA Tour. The official tour does not publish comprehensive strokes gained data, and third-party platforms provide less granular DP World Tour coverage. The practical response is to use dual-card players’ PGA Tour SG data as a cross-reference, apply wider confidence intervals to DP World Tour predictions, and use traditional proxy statistics where direct SG data is unavailable. Treat DP World Tour picks as carrying roughly 25-30% more uncertainty than equivalent PGA Tour picks at the same price.
On bookmaker use of SG data: yes, the major UK bookmakers are aware of strokes gained data and their trading teams incorporate it to varying degrees. But bookmaker pricing is influenced by many factors beyond analytical models — including liability management, public betting patterns, and promotional pricing decisions. The gaps between model and market that the workflow above is designed to find do exist, and they exist partly because bookmakers are not solely optimising for analytical accuracy. They are optimising for commercial outcomes. That distinction is what creates systematic betting opportunities.
Frequently Asked Questions
Which strokes gained category is the strongest predictor of tournament wins on PGA Tour?
SG: Approach to the Green is the strongest predictor. Fried Egg Golf's analysis showed it accounted for roughly 30% of winning strokes among Masters top-5 finishers over five recent seasons. DataGolf data confirms that none of the five most recent Masters winners ranked in the top 10 of their field for SG: Putting - approach play, not putting, drives Major results.
Is strokes gained data available for DP World Tour and how reliable is it?
Comprehensive official SG data is not published for DP World Tour events in the same format as PGA Tour. DataGolf and similar platforms provide limited coverage. The practical workaround is to use PGA Tour SG data for dual-card players and apply wider uncertainty margins to DP World Tour predictions. Treat DP Tour picks as carrying roughly 25-30% more forecast uncertainty than PGA Tour equivalents.
How far back should you look at strokes gained stats when analysing a golf tournament?
A decay-weighted 36-round window is the recommended approach. Weight the most recent 12 rounds at double the importance of rounds 13-24, and rounds 25-36 at half weight. Below 20 rounds total you are reading too much noise. Above 50 rounds with flat weighting you are including stale data that may not reflect the player's current form profile.
Do bookmakers use strokes gained data when setting golf outright prices?
Yes, leading UK bookmakers incorporate SG data into their pricing models to varying degrees. However, bookmaker odds also reflect liability management, public betting patterns, and commercial objectives - not purely analytical accuracy. This means SG-based models can still identify consistent price discrepancies, particularly in the 30/1 to 80/1 range where market efficiency is lower than at shorter prices.
Golf Betting Guides
Golf Spread Betting UK: How Index Betting Works and When It Beats Fixed-Odds Systems
I came to spread betting in golf late, and honestly, somewhat reluctantly. After years building fixed-odds systems, the idea of…
Golf Betting Weather Analysis: How Wind, Rain, and Tee Time Draw Affect Your System Picks
Weather is the variable in golf betting that most systematic bettors acknowledge as important and then treat imprecisely. They'll note…
Golf Betting Odds Comparison UK: How Best-Price Shopping Compounds System Returns
The most underrated skill in systematic golf betting is not finding value selections—it's getting the best available price on the…
First Round Leader Golf Betting: A Systematic Approach to the FRL Market in the UK
The FRL market has a reputation problem. Casual bettors treat it as a novelty—a punt on who happens to have…
