
Golf Betting Driving Distance Stats: When Power Off the Tee Creates a Systematic Edge
 Available in US
There’s a version of the “power advantage” argument in golf that gets recycled endlessly in betting previews — “this course rewards big hitters, so back the bombers” — and there’s a more precise, less intuitive truth that most of those previews miss entirely. At Augusta National in 2026, strokes gained: approach play accounted for roughly 30% of the performance advantage that separated the top of the leaderboard from the field. SG: off-the-tee contributed, but it was the second shot — made easier by a shorter approach distance — that created the compounding edge. The distance advantage is real; the mechanism is more nuanced than the headline.
Understanding when and how driving distance translates into a measurable betting edge requires separating two distinct concepts: raw driving distance as a statistic, and SG: off-the-tee as a performance measure. They’re related but they’re not the same thing, and using one when you mean the other is a surprisingly common source of analytical error in golf betting.
Distance, Course Type, and Why the Edge Is Conditional
The tracks where driving distance creates the clearest systematic edge share specific characteristics: wide fairways that don’t punish errant length, par-5s that are reachable in two only by longer hitters, and approach shot distances that vary enough between bombers and shorter hitters to produce meaningfully different scoring opportunities. Courses like Augusta National, Kapalua’s Plantation Course, and TPC Boston fit this profile. Courses like Carnoustie, narrow-tree-lined tracks on the PGA Tour, or courses where rough penalties are severe enough to punish offline length do not.
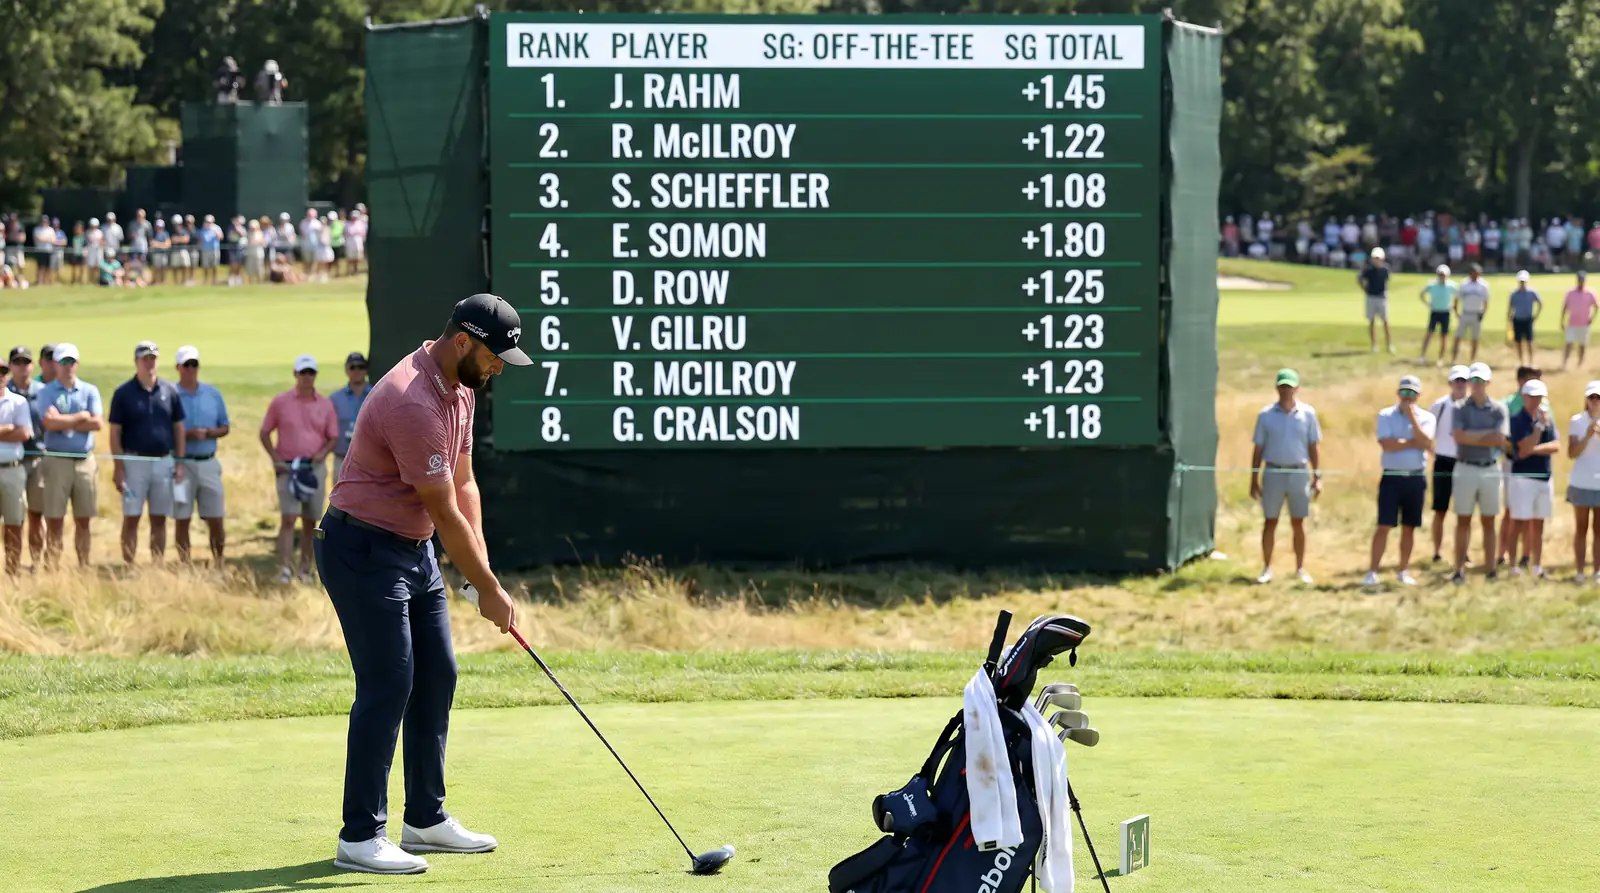
At aerial-style courses — typically large, open layouts where the primary challenge is managing distance rather than accuracy — the correlation between driving distance and finishing position is measurable and consistent. The mechanism is the approach shot: hitting a 9-iron versus a 5-iron into a par-4 green from different distances to the flag produces a material difference in expected strokes gained from approach, even between two competent iron players. Compound that across 72 holes, and the longer hitter’s structural advantage becomes real. Analysts who have modelled Augusta specifically find that the distance advantage there is particularly durable because the course’s unusual undulations make long-iron approaches substantially harder than short ones, amplifying the gap between bombers and mid-length players.

The conditional nature of the edge is what makes distance stats genuinely useful as a betting tool rather than a blanket selection criterion. Saying “back long hitters this week” without specifying which week and which course is not a systematic approach — it’s a preference. Saying “at this specific track, players ranked in the top 30 for SG: off-the-tee have won at a rate roughly 40% higher than their market-implied probability over the past five years” is a systematic observation. The former is vague; the latter is actionable.
SG: Off-the-Tee vs. Average Driving Distance: Which Metric to Use
Average driving distance is the simpler of the two statistics and the one most frequently cited in golf betting previews. It’s publicly available from PGA Tour stats and easy to rank. Its weakness is that it measures only one dimension of tee-shot performance — how far the ball travels — without capturing where it lands, how often fairways are hit, or the penalty for misses. A player who averages 315 yards but misses 40% of fairways is structurally different from one who averages 305 yards and misses only 20%. Driving distance alone doesn’t tell you which player is the better tee-shot performer for a specific course.

SG: off-the-tee solves most of this. It measures the total strokes gained or lost by a player’s tee shots relative to the field average, incorporating both distance and accuracy. A player who gains 0.8 strokes per round off the tee is a genuinely elite ball-striker in that category regardless of whether their average distance is 295 or 320 yards. The metric captures the outcome — how many shots ahead or behind the field average the tee shot puts you — rather than the input variable of distance alone.

For betting purposes, SG: off-the-tee is the superior metric for two reasons. First, it allows direct comparison across players of different distance profiles — you’re comparing the output of their tee shots, not a physical characteristic. Second, it’s more predictive than driving distance average in most analytical models, because it captures the full value of both distance and accuracy rather than just one dimension. For a deep dive on how SG categories integrate into a full selection model, the framework is laid out in detail in the strokes gained golf betting guide.
The practical application: when identifying players with a structural advantage at a distance-rewarding course, use SG: off-the-tee over the last 24 rounds as your filter, not raw distance ranking. Pull the players in the top quartile for SG: OTT from the field, then cross-reference with SG: approach — because the distance edge only compounds if the player is actually converting the shorter approach into strokes. A bomber who struggles from 150 yards with an iron is gaining less advantage than the headline distance figure suggests.
Where Distance Stats Lose Their Edge
The distance-advantage narrative breaks down in three predictable scenarios that are worth building explicitly into your process. First: when the course setup introduces a meaningful rough penalty for offline tee shots. Rough that genuinely penalises errant length — US Open rough, for example, or narrow-fairway tracks on the DP World Tour — compresses the advantage for long but occasionally wayward hitters. In these weeks, driving accuracy or fairways hit percentage becomes a more relevant filter than pure distance.
Second: when weather conditions reduce the distance advantage. Soft, wet conditions on a parkland course effectively close the gap between shorter and longer hitters because the fairways aren’t running and distance differences become smaller. On a firm, fast course in the same weather, distance advantages amplify. Always check forecast conditions before applying distance-based filters, particularly in the UK and European tour context where weather variance is high.

Third: when a player’s recent SG: OTT figure is driven by one or two exceptional weeks rather than a consistent underlying level. A player averaging plus 1.2 SG: OTT over the last six events but whose individual round scores show wide variance — with two weeks at plus 2.5 and four weeks close to zero — is a less reliable distance-advantage pick than one averaging plus 0.8 consistently across all six events. Variance in the underlying data is a flag worth noting when distance stats look compelling at first glance.
Frequently Asked Questions
Should I use SG:OTT or average driving distance for betting analysis?
SG: off-the-tee is the more useful metric for systematic betting because it captures the full value of a player's tee shot performance, including both distance and accuracy, rather than one dimension alone. A player who gains 0.8 strokes per round off the tee is demonstrably outperforming the field in that category regardless of their raw yardage. Use average driving distance as a quick orientation tool when SG data is unavailable -- particularly on the DP World Tour where SG coverage is patchier -- but default to SG: OTT when the data exists.
Which Major championship rewards driving distance most consistently?
Augusta National has the strongest documented relationship between distance advantage and tournament performance among the four Majors. The combination of wide fairways, reachable par-5s, and approach shots that vary significantly in difficulty based on distance to the pin makes long hitting structurally advantageous in a way that compounds across 72 holes. The US Open, by contrast, typically sets up to reduce the distance advantage through narrow fairways and thick rough that punishes offline tee shots. The Open Championship and PGA Championship sit between these extremes, depending on the specific venue and setup for that year.
Is DP World Tour driving distance data reliable for betting models?
Partially. The DP World Tour publishes some distance and accuracy data but SG coverage on the European circuit is less comprehensive and less standardised than PGA Tour SG data. The field quality also varies more significantly week to week on the DP World Tour, which means the same SG: OTT figure against a weaker field carries less weight than the same number against a full PGA Tour field. Use DP World Tour distance data as a directional indicator rather than a precise model input, and weight it less heavily than equivalent PGA Tour data in your analysis.
Golf Betting Guides
UK Golf Betting Regulations 2025: What the New Gambling Commission Rules Mean for Systematic Bettors
The regulatory environment for UK sports betting changed more significantly in 2025 than in any year since the Gambling Act…
Golf Betting for Beginners UK: Understanding the Markets Before You Build a System
If you've never bet on golf before and you're trying to figure out where to start, I want to save…
Major Golf Tournaments Betting UK: How the Four Majors Demand Different Systematic Approaches
There's a mistake I made for the first several years of serious golf betting that I see repeated constantly by…
Golf Betting Weather Analysis: How Wind, Rain, and Tee Time Draw Affect Your System Picks
Weather is the variable in golf betting that most systematic bettors acknowledge as important and then treat imprecisely. They'll note…
