
Golf Betting Form Guide UK: How to Read Player Form Without Being Misled by the Leaderboard
 Available in US
A player finishes 4th at a WGC event, then 67th the following week, then wins the week after that. If you were reading form purely through finishing positions, you’d probably conclude he played poorly in week two — but his underlying strokes gained numbers across all three events barely moved. The leaderboard lied. That’s a pattern I see punters misread constantly, and it costs them more than any individual bad pick does.
Reading golf form correctly is not about finding the player who looked sharpest on highlights. It’s about separating genuine skill fluctuations from variance — the weather, the draw, the course layout, the simple randomness that governs a significant portion of any 72-hole result. Once you understand where the signal is versus where it’s just noise, form analysis becomes a far more reliable input into your selections.
Leaderboard vs. Stats: Why Finishing Position Tells You Less Than You Think
Matt Courchene of DataGolf has noted publicly that golf is “noisy” — most of the variation in scoring on any given day is genuinely unpredictable. That unpredictability amplifies the gap between what a player actually did with the ball and where they ended up on the leaderboard. A player can strike the ball beautifully for four rounds, make every approach count, and still miss the cut because their putter went cold on Thursday and Friday.
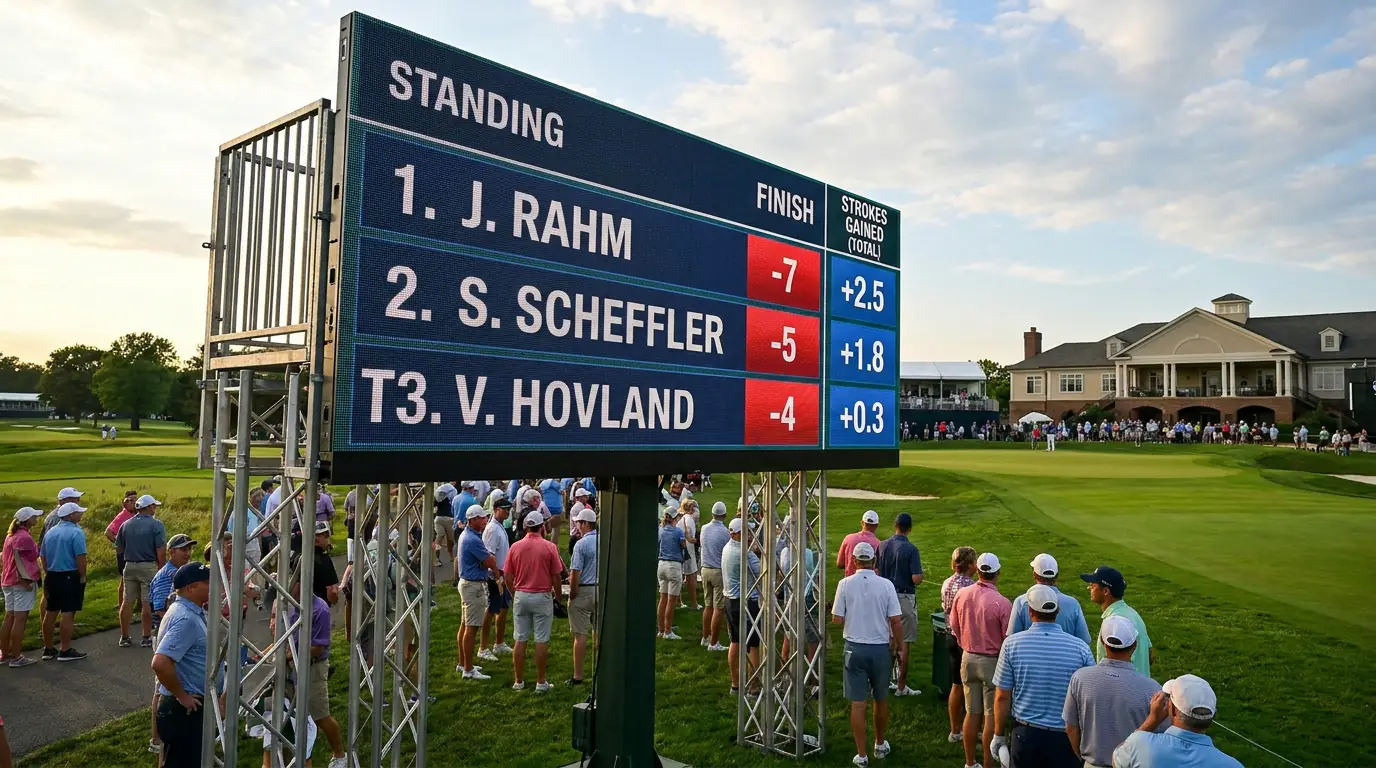
This is the fundamental problem with leaderboard-based form assessment. Finishing positions aggregate too many independent variables — putting variance, course conditions, pairing luck, tee time draw, and genuine ball-striking performance — into a single number that smooths over all the detail you actually need. A 40th place finish at a deep-field Rolex Series event often reflects more genuine quality than a top-10 at a weaker DP World Tour co-sanctioned event. The numbers don’t tell you which is which. The underlying data does.

The correction is to read SG data rather than positions. SG: total tells you how many strokes per round a player gained or lost relative to the field average. A player running at plus 1.5 SG: total over their last eight rounds is performing at a high level regardless of where they finished. A player running at plus 0.2 SG: total is performing near the field average regardless of a fortuitous top-10 that came from a hot putter over 36 holes. This distinction matters enormously for any bet you place on the following week’s event. For the full methodology on using SG data as a selection tool, the strokes gained golf betting guide covers each category in detail.
There’s a secondary distortion in form reading that comes from weight-of-shot confusion. A missed cut in a 156-player event doesn’t necessarily mean the player played badly — it could mean they played at a level that would make the cut in 60% of fields but ran into a week where the scoring average was two shots lower than usual. Without the underlying SG context, you’ll penalise players unfairly for difficult-week results and reward players falsely for easy-week performances.
The Form Window: How Far Back You Should Actually Look
One of the most common errors I see in punter analysis is using too short or too long a form window. Too short — say, last two events — and you’re responding to variance more than skill. A player can go minus-4 SG over two rounds entirely because of one bad driving day and one missed putt avalanche; that’s not form deterioration, that’s noise. Too long — 40+ rounds — and you’re including performance data from six to eight months ago that may no longer reflect the player’s current capabilities.

The research consensus from analysts who have looked at this systematically points to a range of 20 to 36 rounds as the most predictive window for most SG categories. That roughly corresponds to five to nine recent events. Within that window, recent rounds should carry more weight than older ones. A player’s last 12 rounds are more informative about current level than their rounds from 25 to 36 weeks ago — not because the older data is irrelevant, but because players change. They work on weaknesses, they pick up injuries, they shift between equipment, they adjust their schedules.

The exception to this window is course-specific form. When a player has a strong historical record at a specific venue — not just finishing positions but genuine SG performance at that track — that history can extend further back. Augusta National is the most documented example: the course rewards specific ball-striking patterns that don’t vary much year to year, so a player’s performance across five previous visits may be meaningful even if some of those visits were four or five years ago. For most PGA Tour venues, however, the course changes enough between visits (setup, rough height, pin positions) that results from more than three years back are thin signal.
Practical application: when you’re analysing a player’s form for a weekend tournament, pull their SG: total, SG: approach, and SG: off-the-tee for their last six events, weight the most recent three events at roughly double the weight of the three before them, and note whether the trend is flat, improving, or declining. That weighted score gives you a far more reliable current-form indicator than the finishing positions column in a standard form guide.
Integrating Form Into Your Selection Process Without Overcrowding the Model
Form analysis is a powerful input, but it’s not the whole model. The risk I’ve noticed — in my own process and in how other systematic bettors describe theirs — is letting positive recent form justify a price that simply doesn’t offer value. A player who is genuinely in the best form of their career is already reflected in the bookmaker’s price. If they’re 8/1 this week when they’d normally be 20/1, the market has done most of the work for you. Chasing in-form players at compressed prices is how systematic bettors accidentally become trend-followers.
The right integration is to use form as a filter for eligibility, not as the primary driver of selection. A player needs to show adequate recent SG performance to qualify for consideration — that’s the form threshold. Once they clear that threshold, the selection decision is driven by price versus estimated probability. If a player is in excellent form but the market has already priced that in, they’re not a bet. If a player is in solid — not spectacular — form but is priced as though they’re struggling, that’s where the value conversation starts.

I also use form as a disqualifier. If a player I’d otherwise like at a price has shown a significant decline in SG: approach over their last four events — not variance, but a genuine trend downward — that’s a reason to pass even if the price looks attractive. The price may reflect the market’s assessment of a player’s ceiling; the declining approach numbers may be telling you the floor is lower than the market has adjusted for.
One final calibration: weight your analysis slightly more heavily for events where ball-striking dominates and slightly less heavily for events where putting variance tends to govern results. A firm, fast course on pure bentgrass greens amplifies putting variance; a windswept links where approach play from 150 metres means everything makes your ball-striking SG data far more predictive. Understanding which form metrics matter most for the specific event you’re betting on is what separates nuanced form reading from a one-size-fits-all SG lookup.
Frequently Asked Questions
How many rounds of recent data should I use for form analysis?
Twenty to 36 rounds is the range supported by most analytical work on SG predictability. In practical terms, that's five to nine recent events. For the most useful signal, weight the most recent 12 rounds at roughly twice the importance of the 13-to-36 round window. Using fewer than 16 rounds introduces too much short-term variance; using more than 40 rounds risks including data that no longer reflects the player's current level.
Does a 50th place finish mean a player is out of form?
Not necessarily — context is everything. A 50th at a 156-player major-calibre event in a tough week with moving-day scoring averages of 72 may represent perfectly adequate ball-striking performance. What matters is the SG: total figure for that week relative to the field. If the player ran at plus 0.8 SG: total, finished 50th because putting let them down, and is otherwise trending well, that result is not a form concern. If they ran at minus 1.2 SG: total and lost strokes across every category, that's a genuine signal regardless of the finishing position.
Should you weight form from stronger events more heavily?
Yes, and this adjustment is more important than most amateur form guides acknowledge. Strokes gained data from deep fields -- full-field PGA Tour events, Rolex Series, and Majors -- is more predictive than SG data from weak co-sanctioned events or invitational fields of 60 players. A plus-2.0 SG: total performance against a full 156-player PGA Tour field is a stronger signal than plus-2.0 against a weaker 78-player DP World Tour field. Many public form guides treat all events equally; adjusting for field quality adds a genuine edge to your analysis.
Golf Betting Guides
Golf Betting Odds Comparison UK: How Best-Price Shopping Compounds System Returns
The most underrated skill in systematic golf betting is not finding value selections—it's getting the best available price on the…
Three-Ball Golf Betting Strategy: Building a Systematic Edge in Head-to-Head Group Markets
Three-ball markets were the first place I ever found a genuine, repeatable edge in golf betting. Not because they're easier…
Each Way Extra Golf Explained: How to Decide When the Enhanced Terms Are Worth Taking
In 2025, bet365 offered 563 additional each-way places across golf events through their Each Way Extra feature. That's not a…
Golf Betting Value Finder: How to Calculate Expected Value Before Every Systematic Pick
Nine years into this, I still do the same arithmetic before every single outright pick. Not because the maths is…
