
Course Fit in Golf Betting: How to Analyse Track Suitability and Find Underpriced Players
 Available in US
Years ago I backed a player at 33/1 for a Signature Event purely on the back of four consecutive top-20s, strong recent strokes gained numbers, and a price that looked generous relative to his form. He finished tied 47th and I had no idea why. A week later, looking at the course data, it was obvious: the event was on a tight driving accuracy course with small greens and a premium on approach precision from 100-150 yards, and this player’s profile was entirely the opposite — a big hitter with average approach numbers who thrived on wide-open courses where distance off the tee created shorter approach yardages. His 33/1 was not the market mispricing I thought it was. It was a fair price for his specific fit at that specific venue. I was betting his general quality, not his likely performance at this track. That is a category error that costs bettors money every week.
Course fit analysis is the layer between raw strokes gained data and a betting decision. It converts a player’s statistical profile from a general ranking into a tournament-specific expectation. Without it, you are selecting players based on how good they are, not based on how good they are likely to be at this place, in these conditions, on this design of course. That distinction — between general quality and specific suitability — is where a large portion of the systematic edge in golf betting actually lives.
TheLines.com, drawing on DataGolf’s Course History tool, documented an instructive example: “Course history matters more at Augusta than for any other event on PGA Tour, and creative ball-strikers thrive, as demonstrated by the winners including Hideki Matsuyama, Tiger Woods, Sergio García, Bubba Watson, and Phil Mickelson.” That finding — that Augusta specifically amplifies the importance of course fit relative to general form — is not a curiosity. It is the most-studied case of a consistent structural pattern that repeats, in varying degrees, at every venue on the tour calendar.
What Course Fit Actually Means in a Systematic Golf Betting Context
Course fit is a term that is used casually in golf media to mean almost anything — a player “likes links” or “always does well at Augusta.” Used systematically, it means something specific: the degree to which a player’s statistical profile matches the scoring demands of a particular course.
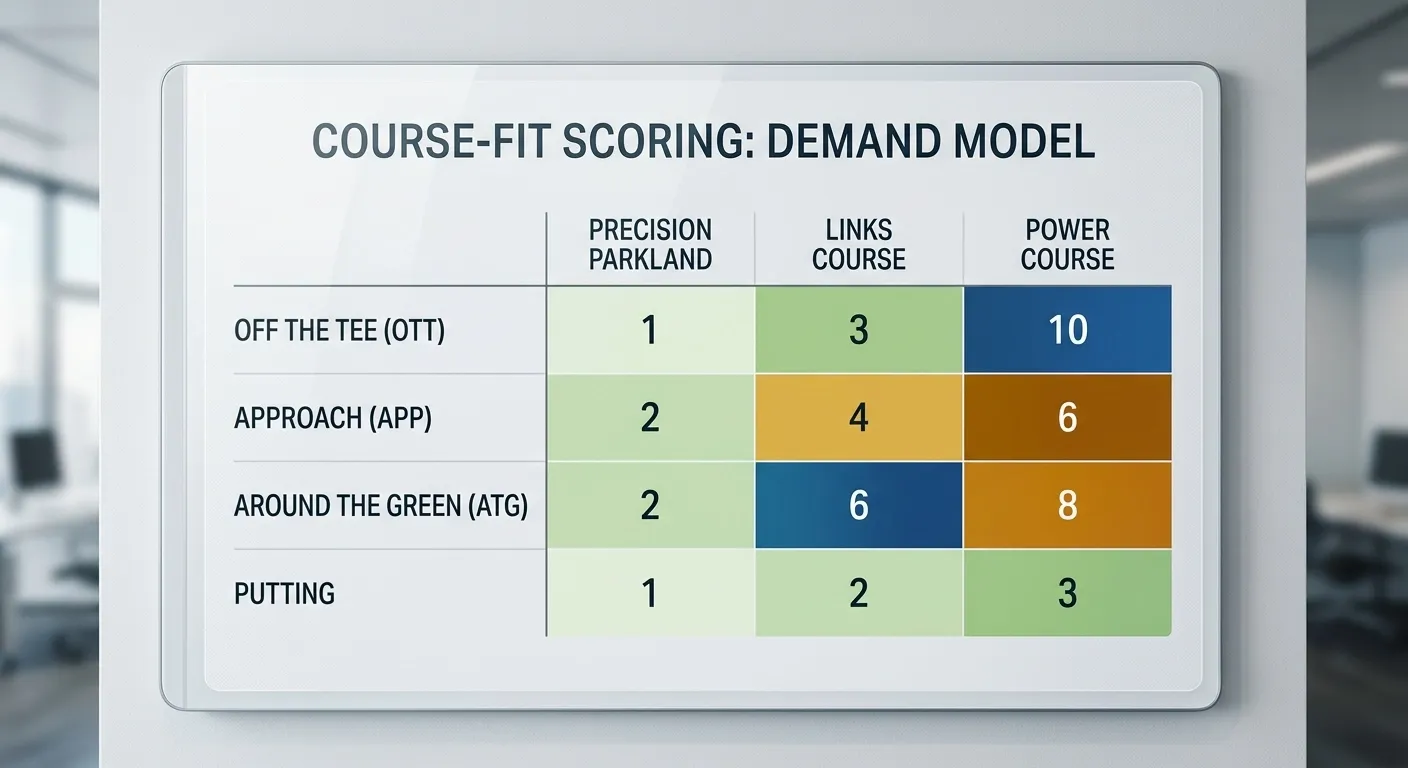
Every golf course rewards certain skills more than others. The combination of routing, green design, rough penalty, course width, and typical weather conditions creates a scoring environment that elevates some shot types and suppresses others. A course with wide fairways, few tight driving corridors, and large greens rewards driving distance and approach from longer yardages — it suits the long-hitter profile. A course with narrow fairways, severe rough, and small targets rewards accuracy off the tee and precision from mid-range — it suits the control-hitter profile. Most courses fall somewhere on a spectrum between these extremes, with specific secondary characteristics (fast greens, links bounce, firm approach surfaces) adding further layers.
Course fit analysis is the process of: identifying a course’s primary and secondary scoring demands, mapping those demands to strokes gained categories and traditional metrics, and then scoring each player in the field against those demands using their recent performance data. The output is a course-fit score — a single number or ranking that tells you, independent of the market price, how well each player’s profile aligns with this specific venue.
What course fit is not: it is not simply course history — the record of a player’s past results at a venue. History contains some signal about fit (if a player consistently performs well at a venue, their profile probably suits it), but it is contaminated by small samples, field strength variation across years, different course setups, and simple variance. A player who has two top-5 finishes at Royal Portrush from three visits has probably got a profile that suits links golf, but two results is not sufficient evidence on its own. Course history is one input into a course-fit framework, not a substitute for it.
It is also not a simplistic classification of courses into types. “Links course” and “parkland course” capture something real, but the within-category variation is enormous. Royal St George’s and Carnoustie are both links courses on the DP World Tour calendar, but their dominant scoring demands are quite different — St George’s has more severe rough penalties and rewards fairway position more than Carnoustie, which in firm conditions rewards a player’s ability to control trajectory and manage the ground game. Treating all links events as fungible is a course-fit analysis error that generates systematic prediction mistakes.
Golf Course Archetypes and the Player Profiles That Win on Each Type
Working with a typology of course archetypes gives you a repeatable starting framework that you can refine with event-specific data. There are five main archetypes that capture most of the variance in course demands across the PGA and DP World Tour calendars.

The precision parkland is the most common archetype on the PGA Tour Signature Event circuit. These courses — typically tree-lined, with firm fairways, moderate rough, and fast greens — reward accurate driving, elite ball-striking from 150-200 yards, and sound mid-range putting. SG: APP is the dominant predictor on precision parkland courses. The player profile that wins here: ranked in the top 20-30 on tour in SG: APP over a 36-round window, with solid but not necessarily elite off-the-tee numbers. Augusta National, widely considered the most course-fit-dependent venue in golf, falls into a premium version of this archetype — but with the additional layer of Augusta’s specific demand for creativity around the greens and an unusual premium on approach from the right angles, which is why “Course history has more importance for the Masters than for any other event on PGA Tour,” as DataGolf’s analysis confirms. Creative ball-strikers win there consistently; elite putters without strong approach games do not.
The power course amplifies the distance premium. At venues like TPC Sawgrass (the Players Championship) and Innisbrook Copperhead, driving distance creates shorter approach yardages, and the combination of SG: OTT and SG: APP is the dominant predictor. The player profile: top 20 on tour in combined driving distance and approach, even if their around-the-green game is merely average. Distance here creates a compounding advantage that shorter players cannot fully compensate for with accuracy.
The links archetype covers Open Championship venues and the DP World Tour’s British Isles events. The distinguishing demands: driving accuracy and positioning over raw distance (the wrong fairway side can mean unplayable angles), above-average SG: ATG (because bump-and-run approaches and chip-and-run from off-the-green are mandatory skills), and tolerance for inconsistent putting surfaces. SG: Putting on links is noisier than on parkland because green grain and wind-affected pace make conventional putting reads less transferable. The player profile: top-tier ball-striker who is comfortable with trajectory control in wind, with strong SG: ATG over the past 24 rounds. This is why certain American players systematically underperform at The Open relative to their world ranking — their game is built for calm-air parkland, not wind-affected links conditions.
The desert archetype covers events in Arizona, Nevada, and similar climates: fast, firm surfaces, minimal rough, premium on approach quality from tight lies and unfamiliar turf conditions. Bermudagrass greens penalise players whose putting has been calibrated for bentgrass, and the firm conditions reward players with strong SG: ATG who can handle the variation in shot difficulty from tight fairway lies. This archetype catches out European-based players more than any other, because the conditions are the furthest from what they encounter week-to-week on the DP World Tour.
The elevation-exposure archetype includes mountain courses and high-altitude venues. Ball flight behaves differently at altitude, club selection is disrupted, and wind exposure creates scoring variation that standard SG data from sea-level venues does not fully predict. The player profile that performs here tends to have a long history at high-altitude events and has calibrated their game accordingly — which is itself a form of course history signal worth tracking.
Overlaying Strokes Gained Data on Course Profile: A Step-by-Step Framework
The overlap between strokes gained analysis and course fit is where the most precise pre-bet work happens. Here is the framework I apply before any significant golf bet.
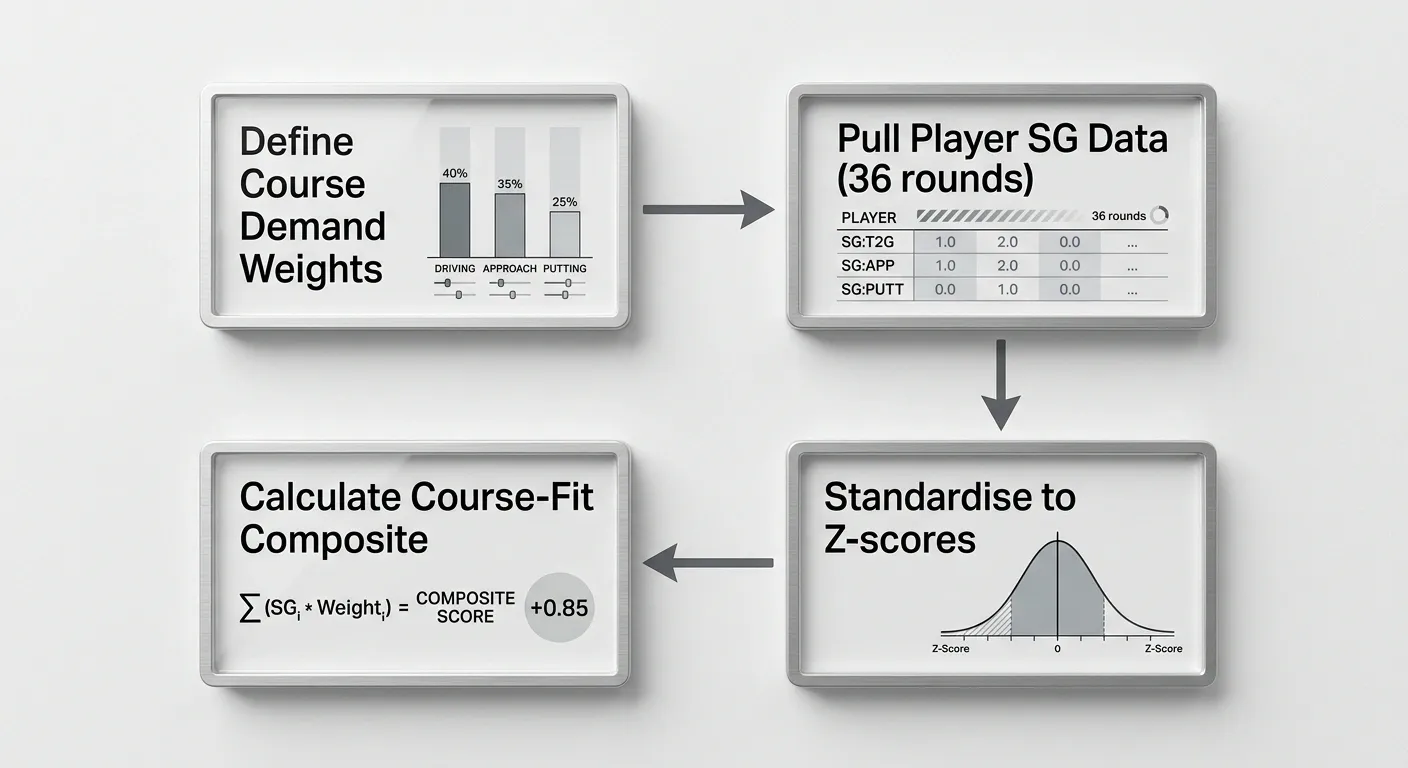
Step one: define the course’s primary and secondary scoring demand weighting. For each of the four SG categories — OTT, APP, ATG, Putting — assign a weight from 0 to 10 based on how much that category drives scoring at this specific venue. A typical precision parkland might score: OTT 5, APP 9, ATG 5, Putting 7. A links course: OTT 7, APP 5, ATG 8, Putting 4. A power course: OTT 9, APP 8, ATG 4, Putting 6. These weights do not need to be precise to three decimal places — they need to roughly reflect which categories matter most at this venue, which you can determine from historical data, course design features, and playing condition reports.
Step two: pull each player’s 36-round decay-weighted SG data for the four categories. Standardise each player’s scores against the field mean and standard deviation for that category, producing a z-score. A player 0.5 standard deviations above mean in SG: APP is meaningfully above average; 1.5 standard deviations is elite-tier.
Step three: calculate a course-fit composite by multiplying each category’s z-score by the course’s demand weight for that category, and summing. The result is a single course-fit score per player. Rank all players in the field by this composite score. DataGolf’s analysis of Masters winners consistently finds that the eventual champion ranks highly in the approach-dominant composite for Augusta — because SG: APP weighted heavily against a field drives 30% of winning strokes at the Masters, and the eventual winner tends to be in the upper quartile on that specific metric. The same pattern, with different category weights, repeats at other premium venues.
Step four: compare your course-fit ranking to the market price ranking. Identify players where your course-fit composite ranks them significantly higher than their implied probability from the market odds. A player ranked 8th in your course-fit composite but priced at 80/1 (implied market rank of perhaps 35th in a 156-man field) is a candidate for examination — the market is pricing their general quality but may not be adequately adjusting for their specific profile advantages at this venue.
This process generates a shortlist of course-fit-favoured, potentially underpriced players. The shortlist still requires the full SG workflow — recency weighting, market comparison, stake-sizing decisions — before a bet is placed. Course fit is a filter that improves the quality of your candidate pool, not an automated betting signal on its own.
How Much Weight to Give Course History vs. Recent Form: A Data-Based Answer
This is a question that does not have a universal answer, because the correct weight for course history varies dramatically by venue. Augusta is the extreme case — course history carries more weight there than at any other event on the PGA Tour, and the DataGolf research that documents this reflects a real structural feature of the Masters: the course’s specific demands are stable year-to-year (same setup, same conditions range, same course design), the field is restricted to elite players with strong course history records, and the prize and preparation pressure select for players who have specifically prepared for Augusta’s challenges. At Augusta, I give course history a weight equivalent to roughly half of a player’s recent 12-round SG data. That is unusually high by general standards.
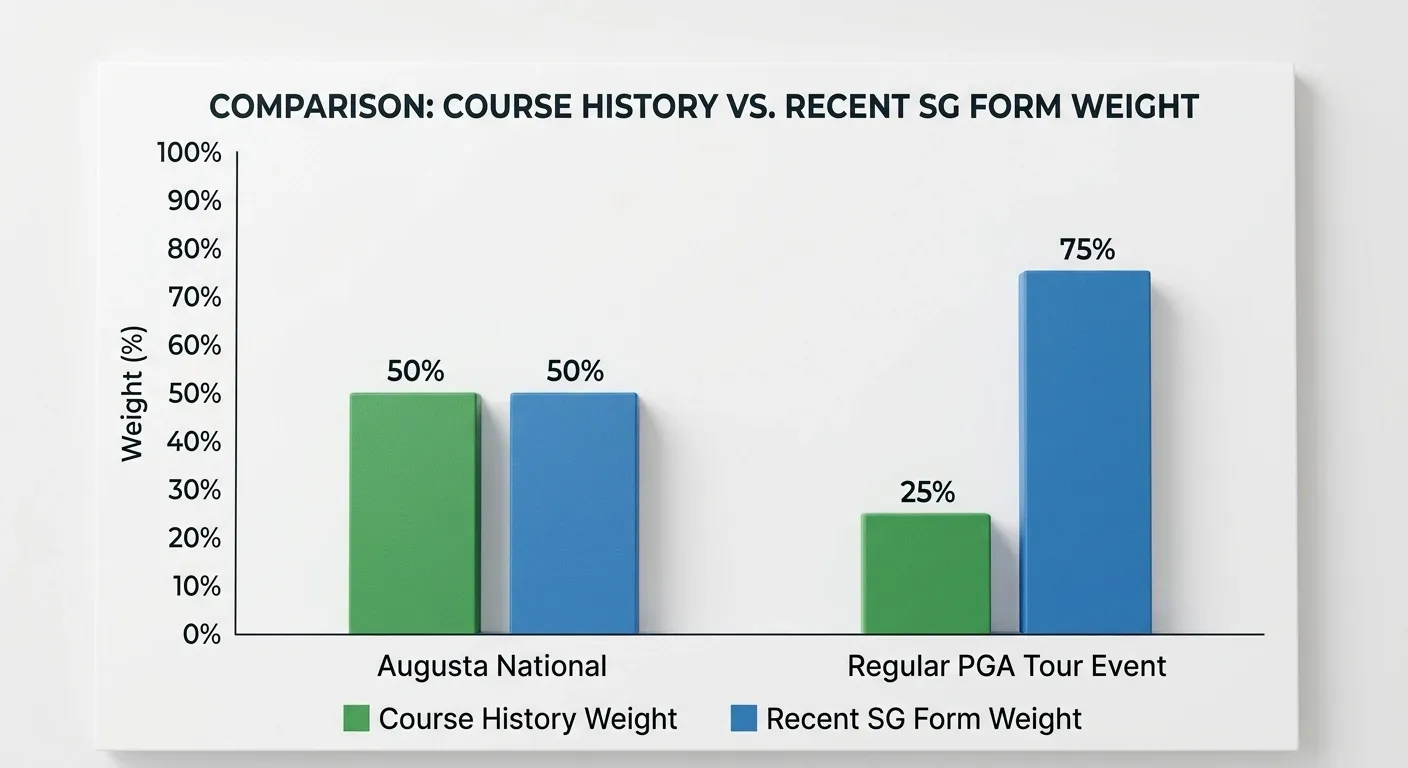
For most regular PGA Tour events — where course setups change year-to-year, fields rotate substantially, and conditions vary more widely — course history deserves a weight of roughly 20-30% of your overall assessment. The reason to include it at all is that repeated good performances at a venue are weak evidence that the player’s profile suits that venue’s demands. But the sample size is almost always small — three to five prior appearances — and the signal-to-noise ratio is correspondingly low. Weight it, but do not weight it heavily.
The exception that increases course history weight for non-Major events: venues with genuinely unusual or distinctive characteristics that are not captured well by standard SG categories. Links courses with firm, ground-game conditions are the primary example. A player’s SG: APP data from parkland events gives limited information about their links ball-striking ability, because the shot demands are qualitatively different. Course history at links-specific venues therefore carries more weight than at standard parkland events, because it encodes information about links-specific skills that the general SG data does not.
The exception that reduces course history weight: when a player has changed their swing, coach, or equipment since their previous appearances at a venue. A 2023 course performance reflects a swing that may bear limited relationship to the player’s 2026 mechanics. If a significant technical change is documented in the period since the most recent historical appearance, discount that historical data heavily — or discard it entirely if the change is recent enough.
Links vs. Parkland Betting: How UK and DP World Tour Courses Split the Player Field
The links versus parkland split is the most practically important course-fit distinction for UK bettors, because the DP World Tour calendar is heavily weighted toward British Isles events — where links or links-adjacent conditions are the norm — while the PGA Tour, which accounts for most betting volume, is primarily a parkland circuit.

The player population that excels at links golf is meaningfully different from the parkland elite. European-trained players who grew up on links-style courses — those from Ireland, Scotland, England, and northern France — typically have a structural advantage in wind management, ground-game shot-making, and tolerance for inconsistent bounce conditions. This advantage is not infinite or guaranteed, but it is real and consistent enough to deserve a systematic adjustment in your models for links events. American players dominate parkland events and Signature Events numerically, reflecting their tournament diet. When the bracket comes to links events, the adjustment for tour-background is a legitimate and demonstrable course-fit variable.
The specific DP World Tour events where links fit matters most: The Scottish Open (played at links venues ahead of The Open), The Irish Open (links and links-adjacent venues), The Alfred Dunhill Links Championship (Carnoustie, Kingsbarns, St Andrews — the definitive links betting event), and the Betfred British Masters (often on parkland but with links-experience field advantages). At these events, the player field is already skewed toward European players who understand the conditions, which partially prices in the links advantage. But pricing it in partially is not pricing it in correctly, and the market still contains identifiable edges for bettors who have built a genuine links-specific player ranking.
Course Fit at Golf Majors: When Augusta, Hoylake, and Oakmont Demand Specific Profiles
Major Championships are the most important events in the golf betting calendar for UK punters, and they are also the events where course-fit analysis pays off most directly. Three venues in particular — Augusta National, Royal Liverpool (Hoylake), and Oakmont Country Club — each demand profiles specific enough that a dedicated course-fit analysis is almost mandatory before any Major bet.
Augusta National is the most-studied case, and the data are consistent. Approach play is dominant: SG: APP accounted for roughly 30% of winning strokes for top-5 finishers at the Masters over the most recent five seasons, with SG: Putting barely featuring in the winner’s profile in four of those five years. Augusta demands ball-striking creativity — the ability to work the ball in both directions, to hit low trajectories into the fast green surfaces, and to attack specific quadrants of greens that are defended by slope rather than greenside hazards. This is a qualitative element that SG data approximates but does not fully capture; it is why course history weight at Augusta is higher than anywhere else, because the historical performance encodes not just general SG quality but specifically Augusta-adapted quality.
Hoylake — Royal Liverpool — is The Open Championship venue that most rewards accurate driving of all the rotation. The course’s relative flatness and specific rough distribution mean that the right quadrant of the fairway is premium, and missing it incurs a disproportionate penalty. SG: OTT accuracy (as opposed to raw distance) is the primary driver at Hoylake. Combined with the links scrambling demands, the player profile that wins at Hoylake tends to show strong OTT accuracy metrics and above-average ATG — not the profile of the longest hitters, but the profile of players who consistently position the ball correctly.
Oakmont, as a US Open venue, presents the most severe rough-penalty environment in Major golf. Driving accuracy becomes paramount because Oakmont’s rough is typically deep enough that advancing the ball to any useful position from it is near-impossible. The SG: OTT accuracy metric — fairways hit percentage combined with proximity to fairway centre — is the leading predictor at Oakmont. Players who rank in the bottom half of driving accuracy on tour are at a structural disadvantage that no amount of ball-striking brilliance can fully overcome when the rough is at full US Open severity.
Finding Underpriced Players: Combining Course Fit Score with Market Odds
The final step in the course-fit framework is connecting your analysis to the market. A player with an excellent course-fit score is not a bet — they are a candidate. They become a bet when the market price implies they are less likely to contend than your analysis suggests. Identifying that gap is the core of the systematic edge in course-fit betting.
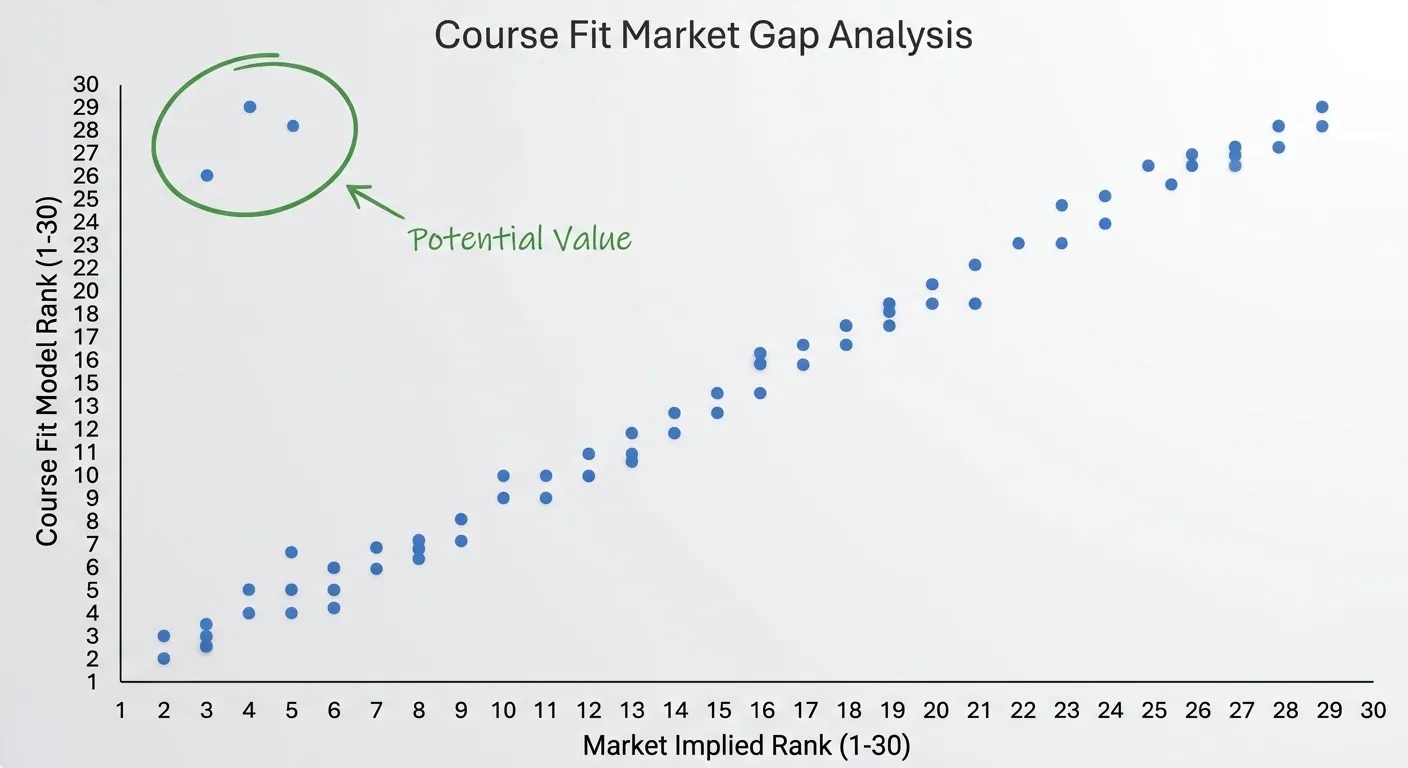
The gap between course-fit-implied probability and market probability concentrates in two situations. First, players with strong course-fit scores but limited recent media visibility — they have not won recently, they have not been in contention at a high-profile event, and the betting public’s money is following names rather than numbers. The market prices narrative; course-fit analysis prices profile. When those two disagree, the data-driven approach finds value that narrative-driven pricing misses. Finding value in the middle price range — 30/1 to 80/1 — where approach quality and course fit are genuine predictors is the practical application of the principle that golf betting is primarily about working with numbers.
Second, players whose SG data has recently improved but whose market price has not yet adjusted. Tour prices are not immediately responsive to model-level SG improvements — a player who has spent 12 rounds quietly improving their approach game from average to above-average may still be priced at a level that reflects their historical profile. The betting market updates prices reactively, based on results, more than proactively, based on underlying statistical trends. A course-fit model that incorporates current SG data rather than historical results will sometimes identify these situations before the market does.
The workflow connecting course fit to bet placement: generate your course-fit composite ranking, identify candidates where fit ranking significantly exceeds implied market probability, run those candidates through the full SG analysis workflow in our guide to strokes gained golf betting, and apply the each-way terms check against the shortlisted selections. The course-fit layer does not replace the SG analysis — it filters and improves it. Together, they produce a pre-bet process with more distinct information inputs than either layer provides alone.
Course Fit Golf Betting: Questions Answered
The most common course-fit questions I hear from bettors who are trying to integrate this into their system all reflect a genuine curiosity about which variables actually matter and in what proportions. Here are direct answers.
On course history versus recent form: course history deserves 20-30% weighting at most venues, rising to approximately 50% at Augusta and other venues with distinctively stable, well-documented course demands. Recent form in strokes gained terms should carry 70-80% of the weight at regular events. The exact balance depends on how consistent the course’s setup is year-to-year and how much of the course’s scoring demand is captured by standard SG metrics.
On links SG data: the lack of direct DP World Tour SG data for links events is a real analytical challenge. The best proxy is using PGA Tour SG: ATG and trajectory-control metrics combined with course history at links-specific events. Players who have appeared at The Open or Scottish Open multiple times have an observable links track record that supplements the SG gaps.
On Augusta being structurally different: yes, in the specific sense that course history weight is higher at Augusta than anywhere else, and the creative ball-striking demand is more qualitative than SG data fully captures. The five-year Masters data — no top-10 putter in the winner’s field across the most recent winners — is not a fluke. It is a structural feature of Augusta’s design that specifically suppresses the value of putting skill while amplifying the value of approach creativity.
On applying course fit to three-ball and first-round-leader markets: yes, and it is underused in those markets. In three-ball betting, the group composition creates a mini-field where the course-fit differential between three specific players matters more, not less, than in the outright market. A player with a significant course-fit advantage over their two grouped opponents — even if their general quality is similar — is systematically underpriced in three-ball markets where bookmakers price on recent general form rather than specific course-profile matchups.
Frequently Asked Questions
How important is course history compared to recent form when betting on golf outrights?
At most regular PGA Tour events, recent strokes gained form carries 70-80% of the weight, with course history at 20-30%. At Augusta National, that balance shifts significantly - course history deserves roughly 50% weighting because the venue's specific demands are stable year-to-year and historical performances encode Augusta-specific skills that general SG data does not fully capture.
Which strokes gained category matters most for links golf courses on the DP World Tour?
SG: ATG is most important at links venues, because chip-and-run approaches and scrambling from variable lies are mandatory skills. SG: OTT accuracy matters more than raw distance at tight links courses. SG: Putting carries less weight than on parkland, because links green surfaces are less predictable and putting form from parkland events transfers imperfectly.
Is Augusta National's course profile fundamentally different from other Major venues?
Yes. Augusta amplifies the importance of SG: Approach more than any other Major venue, and specifically rewards creative ball-striking - the ability to work the ball both directions and control trajectory into fast greens. DataGolf data confirms no recent Masters winner ranked in the top 10 of their field for SG: Putting. This makes Augusta the most extreme case for applying course-fit analysis before placing a bet.
Can course fit analysis be applied to three-ball and first-round-leader markets?
Yes, and it is systematically underused in both markets. In three-ball betting, a player with a meaningful course-fit advantage over their two grouped opponents is underpriced if bookmakers have priced the matchup on general recent form alone. In first-round-leader markets, players whose profile specifically suits the hole sequence and likely conditions of the opening round deserve a course-fit premium over their general outright price.
Recommend
Golf Betting Bankroll Management UK
The most common story I hear from people who have tried and abandoned golf betting systems goes like this: the…
Golf Betting Weather Analysis: How Wind, Rain, and Tee Time Draw Affect Your System Picks
Weather is the variable in golf betting that most systematic bettors acknowledge as important and then treat imprecisely. They'll note…
Golf In-Play Betting Strategy UK: How to Find Systematic Value in Live Golf Markets
In-play golf betting is the hardest market to beat systematically, and I say that as someone who has been trying…
Betfair Exchange Golf Betting Strategy: How the Exchange Differs From Bookmaker Systems
My relationship with Betfair Exchange in golf betting has evolved considerably over the years. I started using it primarily as…
